IMG PRO DOCUMENTATION
Your comprehensive guide to the IMG Pro indicator — the ultimate time-saving tool for ICT-based price action trading.
Introduction to IMG Pro
The IMG Pro indicator automates the "heavy lifting" of technical analysis, designed specifically for traders following Trader Mayne's price action system. It serves as a personal assistant that:
- Identifies HTF POIs: Automatically marks Higher Timeframe Points of Interest like Order Blocks, Breakers, and Fair Value Gaps.
- Detects Setups: Alerts you to high-probability trade setups at these key levels (e.g., SFP + MSB).
- Manages Risk: Instantly calculates position sizes, entry prices, stops, and targets based on your account settings.
The system is built to support a Top-Down Analysis approach, ensuring you are always aligned with the higher timeframe structure before taking lower timeframe entries.
Indicator Tiers
Choose the tier that fits your trading needs. Each tier builds upon the previous one.
- HTF Structure: Visualizes Market Structure Ranges on Higher Timeframes.
- Key POIs: Automatically plots Order Blocks (OBs) and Breakers.
- Alerts: Notifies you of HTF Market Structure Breaks (MSB).
- Everything in Basic, plus:
- More POIs: Adds Fair Value Gaps (FVGs).
- Trade Alerts: Signals setups at HTF Extremes and enabled POIs.
- Risk Calc: Automatic Position Sizing and Risk Management tools.
- Exits: Fixed Risk-to-Reward (R:R) exit modules.
- Everything in Lite, plus:
- Extended POIs: Option to extend untested HTF POIs forward.
- Fluid Exits: Dynamic exits based on opposite signals.
- Risk Control: Customisable Maximum Trade Risk settings.
- OB + FVG Overlaps
- Breaker + FVG Overlaps
- Internal Liquidity Levels
- ALL Trade Setups (Trend & Counter-Trend)
- 5 Entry Modes & 4 Exit Modes
- Early Warning Systems
- Automated Backtesting System
- Trend Filter Companion
- Auto Anchored VWAP
System Access
How to Get Started
-
Create an account at IMGPro.ai.
Prefer to pay with Crypto? DM aj_img on Discord.
- Select the product tier that suits your trading style.
- Subscribe to activate your license (access usually within 24 hours).
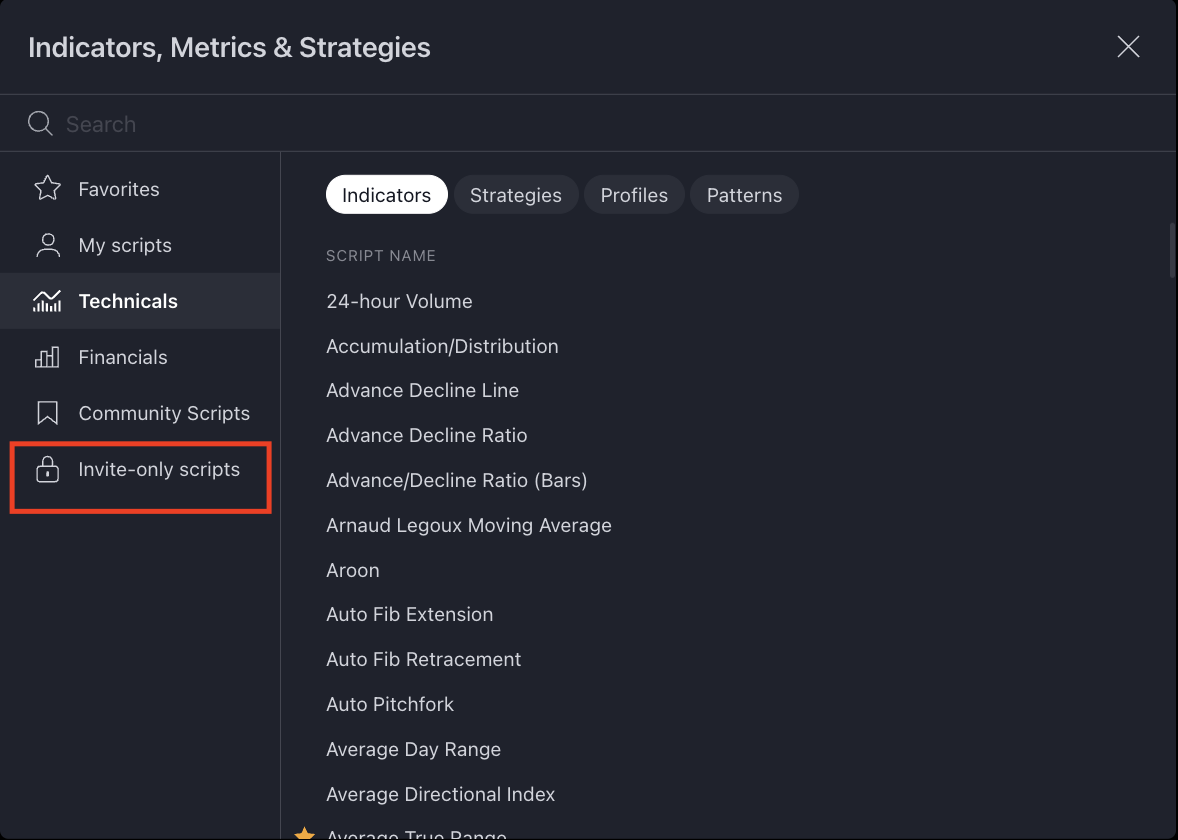
- Locate the indicators in TradingView under Indicators > Invite-only scripts.
Basic Settings
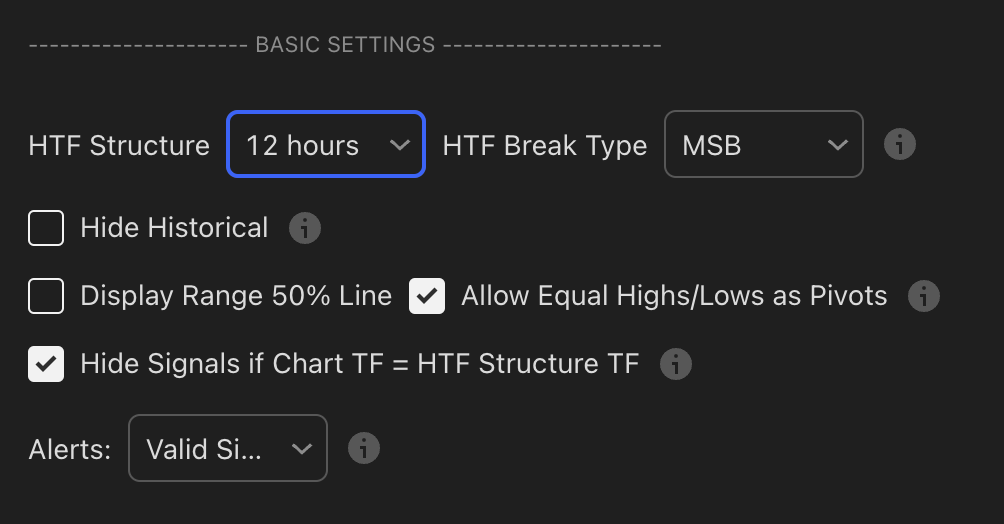
The Basic Settings panel is your "Control Centre" for the entire system. Here, you define the Higher Timeframe (HTF) foundation that the rest of the indicator builds upon.
HTF Structure
How to Configure
- Open the indicator settings.
- Locate the HTF Structure dropdown at the top.
- Select your desired timeframe (e.g., 4h, 12h, D, W).
Description
This setting determines the Market Structure (MS) and Points of Interest (POIs) displayed on your chart. The indicator will map the Highs, Lows, and Trend Bias of this selected Higher Timeframe onto your current chart.
- Bullish Bias: Displayed as Green structure lines.
- Bearish Bias: Displayed as Red structure lines.
Example: H12 Market Structure overlaid on an H1 Chart. View Live Chart Example
.png)
HTF Break Type
Break Type Options
This setting defines how the indicator confirms a Break of Structure (BOS) or Market Structure Shift (MSS).
The standard, conservative approach. A break is only confirmed when a candle CLOSES beyond the key pivot level.
- Bearish Break: Candle body closes below the previous Higher Low.
- Bullish Break: Candle body closes above the previous Lower High.
.png)
These modes represent a more aggressive approach to structure breaks. While they still require a candle CLOSES to confirm valid structure breaks, they validate breaks based on more sensitive internal pivot levels rather than major swing points.
First Opposite Pivot (MSS)
A aggressive approach that identifies new structure points immediately after a break:
- Bearish Structure: High is the first opposite 3-bar pivot high after the break.
- Bullish Structure: Low is the first opposite 3-bar pivot low after the break.
.png)
Closest Opposite Pivot (MSS)
Very aggressive. Uses the closest unbroken pivot point:
- Bearish Structure: High is the closest unbroken opposite 3-bar pivot high to price.
- Bullish Structure: Low is the closest unbroken opposite 3-bar pivot low to price.
.png)
Closest Pivot (MSS)
Extremely aggressive. Applies logic to both sides of the range:
- Bearish: High & Low are the closest unbroken opposite 3-bar pivots.
- Bullish: High & Low are the closest unbroken opposite 3-bar pivots.
.png)
Hide Historical
Clear the Clutter
This toggle allows you to focus solely on the current Market Structure.
- ON: Only the active High, Low, and MSB/POI levels are visible. Old levels are hidden.
- OFF: All historical structure breaks and levels remain visible for backtesting.
.png)
.png)
Display 50% Range Line
Equilibrium (EQ)
This toggle displays a dashed line at the exact midpoint (50%) of the current trading range.
.png)
Equal Highs / Lows as Pivots
Handling Equal Extremes
Sometimes price hits consecutive levels that are nearly identical. This setting helps the indicator recognize these "Double Tops" or "Double Bottoms" as valid pivot points.
Chart TF and Alerts
Managing Signals & Alerts
Alert Configuration Modes
Select how you want the indicator to trigger TradingView alerts:
1. ALL
Triggers an alert for EVERY event: Trade Setups, Stop Losses, Take Profits, Invalidations, etc. Good for logging but can be noisy.
2. Valid Signals Only
(Recommended) Triggers alerts ONLY for triggered trade setups and their associated TP/SL levels. Filters out invalid setups.
Backtest Settings
.png)
Configuration
| Setting | Description |
|---|---|
| Table Size | Adjusts the size of the results table on your chart (Small, Normal, Large). |
| Disable Backtester | Turn OFF to improve chart loading speed if you are not currently backtesting. |
| Custom Start Date | Define a specific starting point for the backtest (e.g., "2023-01-01"). Useful for testing specific market conditions. |
Backtest Results Metrics
| Metric | Description |
|---|---|
| Initial Capital | Your starting account balance. (Tip: Set this to your ACTUAL account size). |
| Available Capital | Current capital based on closed trades only. |
| Net Profit | Total Profit/Loss realized over the test period. |
| Closed Trades | Total number of completed trades. |
| Win Rate | Percentage of trades that ended in profit. |
| Max Drawdown | The largest peak-to-valley drop in equity. High = High Risk. |
| Profit Factor | Gross Profit / Gross Loss. (> 1.5 is ideal). |
| Max Win / Max Loss | The single largest winning and losing trades in the period. |
| Avg Trade Win/Loss | The average P&L per trade. |
| Buy and Hold P&L | Comparison: Profit if you just bought and held the asset vs. trading it. |
| Outperform | How much the strategy beat (or lost to) Buy & Hold. |
Interpreting Results (Color Coding)
The table uses color coding to highlight strategy health, specifically tailored for Prop Firm conditions (High Profit Factor + Low Drawdown).
Max Drawdown (DD)
| DD < 10% | Good |
| DD 10-15% | Caution |
| DD > 15% | High Risk |
Profit Factor (PF)
| PF < 1 | Unprofitable |
| PF 1 - 1.5 | Moderate |
| PF > 1.5 | Strong |
Example Result:
.png)
Higher Timeframe (HTF) Points of Interest (POIs)
.png)
POI 1: HTF Order Blocks
How to Configure
- Open the indicator settings.
- Navigate to the Higher Timeframe (HTF) Points of Interest (POIs) section.
- Locate POI 1 and select HTF Order Blocks from the dropdown menu.
Description
An Order Block (OB) is identified as the last opposite candle to print before a confirmed Market Structure Break. It represents the "footprint" of institutional buying or selling.
- Bullish OB: The last down candle before a bullish Structure Break.
- Bearish OB: The last up candle before a bearish Structure Break.
Example: The H12 Order Block is identified on the left and then projected onto the H1 chart on the right. View Live Chart Example
.png)
Configuration Options
| Option | Function |
|---|---|
| OB Only | Displays all valid Order Blocks derived from the HTF Structure. |
| OB + FVG | Filters results to only show Order Blocks that overlap with a Fair Value Gap (FVG). This is a higher probability confluence. |
| Extend Toggle | When enabled, untested OBs extend to the right until price tests them. |
Invalidation Rules
If "Use HTF Close Through to Invalidate" is enabled (see Settings), stricter rules apply:
- Invalidation: The POI is considered failed if the HTF candle closes completely through the block.
- Wicks: A wick through the block does not invalidate it (limit orders may still trigger).
POI 2: HTF Breaker Blocks
How to Configure
- Open the indicator settings.
- Navigate to POI 2 in the HTF Points of Interest section.
- Select HTF Breaker Blocks from the dropdown.
Description
A Breaker Block is essentially a "failed" Order Block. It is an Order Block that price has impulsively broken through, confirming a shift in market structure. When price returns to test this level, it often acts as strong support or resistance.
- Bullish Breaker: A bearish Order Block (up candle) that price smashed UP through.
- Bearish Breaker: A bullish Order Block (down candle) that price smashed DOWN through.
Example: A bearish H12 Order Block fails and converts into a constant Bullish H12 Breaker on this H1 chart. View Live Chart Example
.png)
Configuration Options
| Option | Function |
|---|---|
| Breaker Only | Displays all valid Breaker Blocks. |
| Breaker + FVG | (Recommended) Filters results to only show Breakers that overlap with a Fair Value Gap. |
| Extend Toggle | Stretches the Breaker zone to the right until it is tested by price. |
Invalidation Rules
Similar to Order Blocks, Breakers remain valid as long as the HTF Structure is intact. However, if HTF Close Through is enabled:
POI 3: HTF Fair Value Gaps (FVGs)
How to Configure
- Open the indicator settings.
- Navigate to POI 3 in the HTF Points of Interest section.
- Toggle Show HTF Fair Value Gaps to ON.
Description
A Fair Value Gap (FVG) is a price range where one-sided buying or selling occurred, creating an imbalance. Market theory suggests price often returns to these gaps to "rebalance" the auction.
- Bullish FVG: Created by a large green candle. The Low of the 3rd candle is higher than the High of the 1st candle.
- Bearish FVG: Created by a large red candle. The High of the 3rd candle is lower than the Low of the 1st candle.
Example: An H12 FVG is identified on the left and projected onto the H1 chart on the right. View Live Chart Example
.png)
Configuration Options
| Option | Function |
|---|---|
| Display Logic | FVGs are structure-agnostic. Both bullish and bearish FVGs from the HTF are displayed if enabled. |
| Confluence Filter | Note: Standalone FVGs will NOT display if they are already part of an OB+FVG or Breaker+FVG (if POI 1 or POI 2 is enabled). This prevents chart clutter. |
| Extend Toggle | When enabled, the FVG zone extends to the right until it is completely filled (price touches the other side). |
Invalidation Rules
POI 4: HTF Internal Pivots (Display Only)
How to Configure
- Open the indicator settings.
- Navigate to POI 4.
- Toggle Liquidity Levels to ON.
Description
This feature displays Untested Internal Pivots from the HTF structure. These are key liquidity/reaction levels within the current trading range.
- Function: Displays horizontal lines representing significant highs or lows within the active HTF Structural Range.
- Behavior: Lines extend to the right until price tests them (liquidity grab) OR the HTF Market Structure breaks (rendering the old range obsolete).
Example: Untested H12 pivots shown within an active H12 structure, displayed on an H1 chart. View Live Chart Example
.png)
HTF Close to Invalidate POIs
Configuration
| Setting | Description |
|---|---|
| Close Through Invalidation |
|
Description
This setting determines exactly when a Point of Interest (OB, Breaker, or FVG) is considered "broken" or invalid.
- Standard Behavior (Default): POIs generally remain valid as long as the HTF Structure itself is valid.
- With "Close Through" ENABLED: The system applies stricter criteria. If a HTF candle closes body-through the POI, that specific POI is immediately invalidated and removed from the chart, even if the overall structure hasn't broken.
Trade Setups
HTF-LTF Trade Setups at HTF POIs
.png)
Range Extremes & Old Untested
How to Configure
- Navigate to the Trade Setups section in settings.
- Locate Range Extremes.
- Toggle Show HTF SFPs and Show HTF-LTF Setups to ON.
Description
This section governs alerts and setups derived from the extremes (Highs and Lows) of the HTF Structural Range.
1. Market Structure Breaks (MSB)
2. HTF Swing Failure Patterns (SFP)
An SFP occurs when price sweeps a Range Extreme (takes liquidity) but fails to close beyond it, closing back inside the range. This indicates a potential reversal.
.png)
Detailed view of an SFP confirmation:
.png)
3. HTF-LTF Trade Setups
This is a high-probability reversal setup. It generates a signal when:
- A HTF SFP is confirmed at a Range Extreme.
- Followed explicitly by a LTF Market Structure Break (MSB) or Shift (MSS) in the opposite direction.
.png)
.png)
Old Untested Highs/Lows
When enabled, the system also monitors significant HTF highs and lows outside the current active range. These levels remain valid for SFPs and Setups until tested or broken.
HTF-LTF Setups at Liquidity
How to Configure
- Navigate to HTF-LTF Setups at Liquidity.
- Select your preferred Mode (At POIs, ALL, or ALL - With Structure).
- (Optional) Toggle HTF SFPs at Liquidity to see the SFP labels without the full setup.
Description
This feature looks for setups at Internal Liquidity levels (pivots inside the range), not just the extremes.
Configuration Modes
| Mode | Function |
|---|---|
| 1. At POIs |
Only displays setups that occur inside enabled HTF
POIs (OBs, Breakers, FVGs).
Best for confluence. Filters out random liquidity runs. |
| 2. ALL (Aggressive) |
Displays setups at ANY internal pivot, regardless
of trend or POIs.
Shows both trend-following and counter-trend trades. |
| 3. ALL - With Structure | Displays setups at any internal pivot, but ONLY if they align with the HTF Trend (Bullish Structure = Longs only). |
Example: "At POIs" enabled. Setup triggers inside an H12 Order Block.
.png)
Example: "ALL" enabled. Shows setups at every valid pivot sweep.
.png)
Example: "With Structure" enabled. Only trend-aligned setups displayed.
.png)
HTF-LTF Early Warning Systems
How to Configure
- Navigate to Early Warning Systems.
- Choose your trigger: LTF Structure Break and/or LTF FVG.
Description
Early Warning Systems generate a potential setup alert before a HTF SFP is confirmed. This typically allows for an earlier entry but carries higher risk as the HTF candle has not yet closed.
Option 1: LTF Structure Break
Signals if price cuts through a HTF level (Range Extreme/Internal Liquidity) and immediately prints an opposite LTF MSB back through that level.
.png)
Option 2: LTF FVG
Signals if price cuts through a HTF level and prints an opposite LTF FVG back through that level. This is the most aggressive entry, often used for "immediate rebalance" plays.
.png)
LTF -LTF Trade Setups at HTF POIs
How to Configure
- Navigate to LTF-LTF Setups.
- Toggle Enable.
- Select filter: Inside HTF POIs or Confirmed HTF-LTF Signals.
Description
This module looks for LTF SFP + LTF MSB setups that occur specifically within high-probability HTF zones. It's a "fractal" entry model.
Mode 1: Inside HTF POIs
Generates a signal if a LTF SFP + LTF Structure Break occurs anywhere inside an active HTF POI (OB, Breaker, FVG).
.png)
Mode 2: Inside Confirmed HTF-LTF Signals
Generates a signal if a LTF setup occurs inside an already confirmed HTF-LTF Setup (e.g., adding to a winning trade or finding a re-entry).
.png)
Trade Entries and Exits
Trade Entries
How to Configure
- Navigate to Trade Entries.
- Select your LTF Break Type (Trigger).
- Select your Entry Mode (Limit vs Market).
Description
This section controls how the indicator confirms a trade and where it tells you to enter.
.png)
LTF Break Type
How to Configure
- Locate LTF Break Type in settings.
- Choose one of the 6 break types based on your aggression level.
Description
The "Break Type" is the specific price action event on the Lower Timeframe (LTF) that confirms the HTF setup.
| Type | Description |
|---|---|
| 1. MSB (Market Structure Break) |
Standard. Closes through the first opposite pivot
to the left of the SFP candle.
.png)
|
| 2. MSS (Market Structure Shift) |
Sensitive. Closes through the first opposite pivot
to the left OR right of the SFP. Useful for spike
liquidity runs.
.png)
|
| 3. CP (Closest Pivot) |
Aggressive. Uses the absolute closest unbroken
opposite pivot after the SFP.
.png)
|
| 4. Breaker: High/Low |
Uses a candle High/Low break instead of a pivot structure break.
Very aggressive.
.png)
|
| 5. Breaker: Close | Same as High/Low but requires a candle Close beyond the level. Slightly more conservative than H/L. |
| 6. First: Breaker or MSS | The "Hybrid" mode. Triggers on whichever happens first. |
Do not Require SFP
How to Configure
- Navigate to Trade Setups.
- Toggle Do not Require SFP to ON.
Description
For Aggressive Breakouts: When enabled, the system ignores the requirement for a liquidity sweep (SFP). Usually, we want to see price sweep a level and close back (SFP). With this on, if price simply breaks a HTF level and then breaks LTF structure, it signals a trade.
LTF Entry Mode & Require FVG
How to Configure
- Navigate to Trade Entries.
- Select Entry Mode.
- (Optional) Toggle Require FVG.
Description
This determines where the limit order is placed once a setup is confirmed. Using a deeper entry mode (like OB) offers higher Risk:Reward but usually fewer fills.
| Entry Mode | Behavior |
|---|---|
| 1. MSB Level (Standard) |
Limit order placed at the line where structure broke.
Pros: High fill rate. Cons: Lower R:R. .png)
|
| 2. Market Entry |
Enter immediately when the signal candle closes.
Pros: Guaranteed entry. Cons: Worst R:R (loosest stop). .png)
|
| 3. Breaker |
Limit order placed at the LTF Breaker Block.
Pros: Balanced R:R and fill rate. .png)
|
| 4. Order Block (OB) |
Limit order placed at the extreme LTF Order Block.
Pros: Highest R:R (tightest stop). Cons: Lowest fill rate (price may not retrace that deep). .png)
|
Require FVG (Filter)
When enabled, a Valid Setup MUST contain an LTF Fair Value Gap (FVG). If the price move is "clean" with no FVG, the signal is ignored.
.png)
Max Trade Risk and Premium/Discount
When enabled, the system will only consider a setup valid as long as the distance between the entry mode and stoploss is within the Max Trade Risk parameters.
Example:
- Confirmed HTF SFP
- Confirmed LTF MSB
- Entry Mode: MSB Level
- Max Trade Risk enabled to 1%
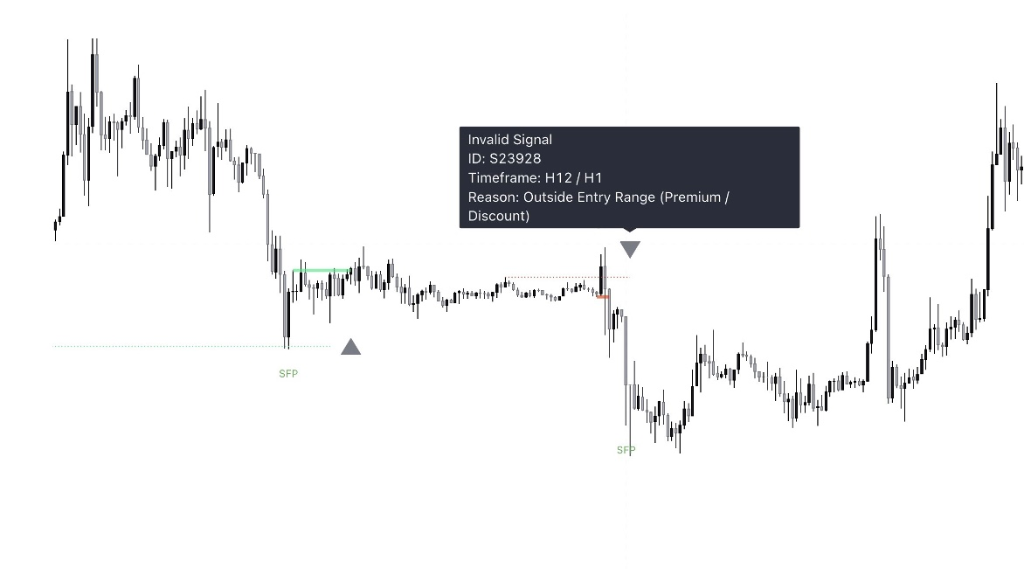
In this example, the system will only treat a setup as valid IF the price difference between the LTF MSB Level and SFP Swing low is less than or equal to 1%. In the chart example below, the system treated this setup as invalid as the price variance between the MSB Level and SFP Low ( Stop Loss) was 1.33%.
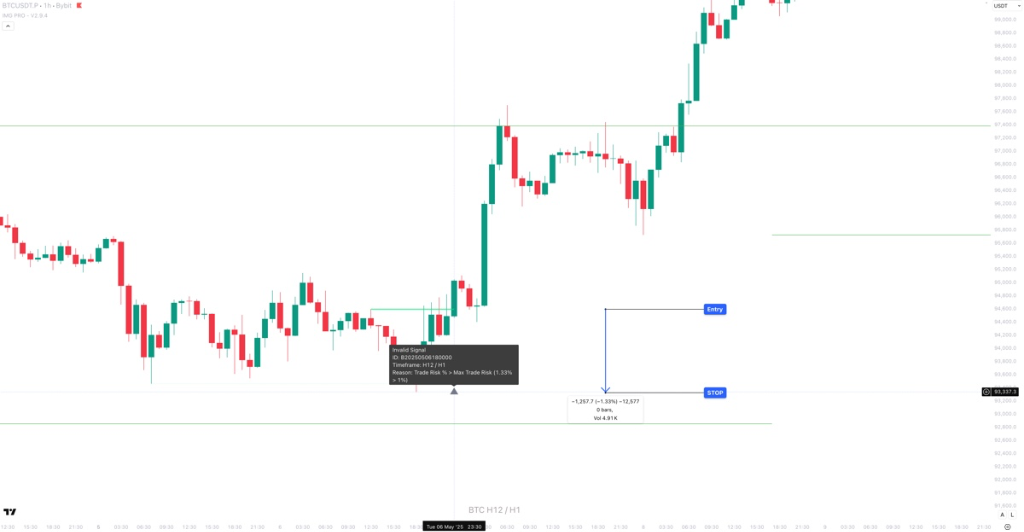
*Invalid setups will still display on the chart with a reason for invalidation (see: grey box in screenshot)*
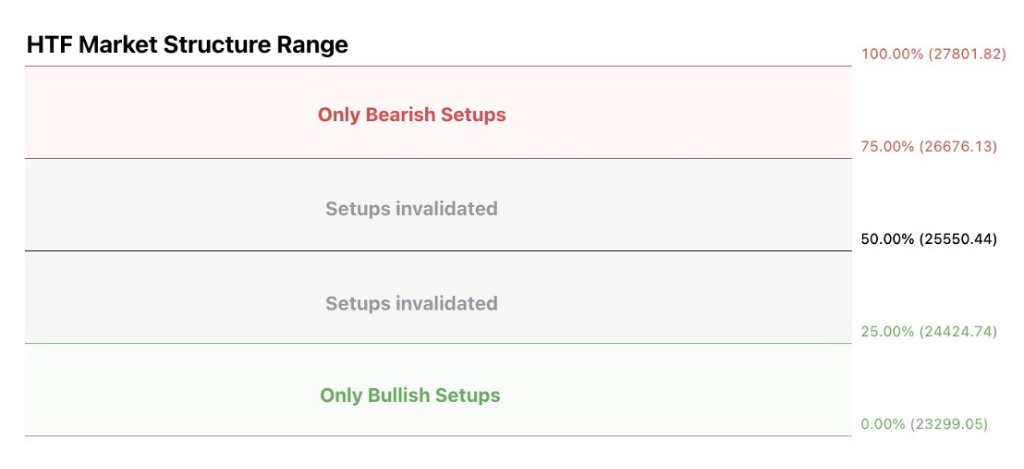
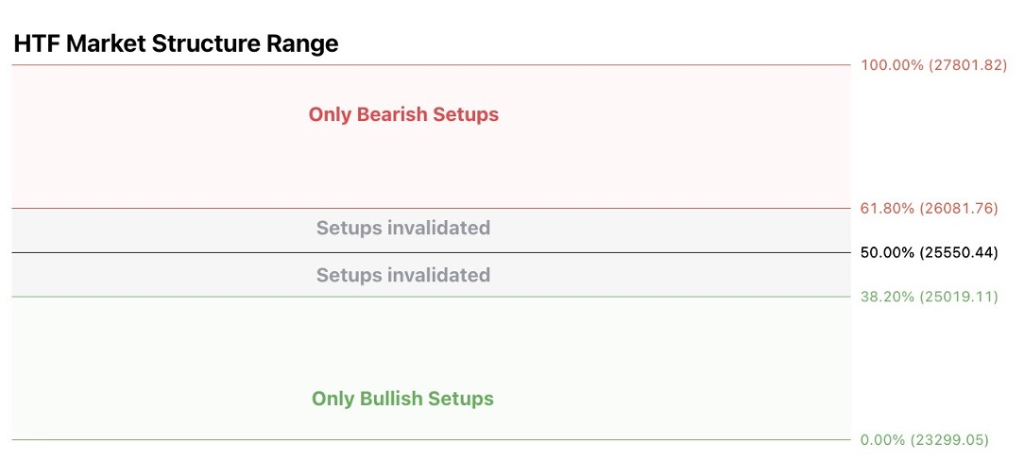
The system can be setup to only display signals that are in the top or bottom n% of the HTF Market Structure Range
A value of 0 (default) will disable the premium/discount system and utilise the entire range for all signal types (bullish and bearish)
To enable the premium / discount system, enter a % value between 0 - 50:
Examples:
A value of 50% will only display bullish signals that have, at minimum, tagged the bottom half of the range and vice versa for bearish signals.
A value of 25% will only display bullish signals that have tagged the bottom quarter of the range and vice versa.
A value of 38.2% will display signals that tag the top and bottom 38.2% of the range (equivalent of the 61.8% OTE. retracement) Etc.
Range activation with 25% premium /discount enabled:
Range activation with 38.2% premium /discount enabled:
Invalidation Labels
When a setup is out of bounds based on these settings, a grey label will appear with details of why the signal is invalid (outside premium/discount levels)
Trade Exits
.png)
Three partial exits at fixed R:R points can be setup. Enter the percentage exit of each partial in the boxes to the left and at what R:R in the boxes to the right.
If being used as stand alone, then the total percentage of the partials needs to add up to 100%.
If being used in conjunction with another exit type (Range Extremes / HTF POIs / Opposite Signals), then the total does not need to add up to 100%.
EXAMPLE: If set to 25% exit at 1R, 50% exit at 3R and “Exit at Valid Opposite Signal” is enabled:
If TP1 and 2 are hit, then the system will exit the balance on a valid opposite signal or Stoploss.
If TP1 is hit and an opposite signal prints before TP2, the entire balance will exit (the system will ignore TP2)
if no TP is hit and a valid opposite signal prints, the entire position will be closed.
Can be used as stand alone exits or in conjunction with Partials as detailed above
Options:
- Any Opposite Signal: The system will exit as soon as any opposite signal prints based on the settings applied. This includes valid and invalid signals. For EXAMPLE, an invalid signals could be an opposite signal without a FVG when “Require FVG in Signal” is enabled
- Valid Opposite Signals: The system will only exit once a valid opposite signal is confirmed. Using the same example above, it will only exit when an opposite signal with a FVG prints.
Can be used as stand alone exits or in conjunction with Partials as detailed above
Options:
- Range Extremes: The position will exit at untested Range Extremes. If the Range Extreme is tested, then it will exit at the highest high or Lowest Low beyond the extreme of a valid range
- Closest Untested HTF POI: When enabled, the system will signal a trade exit when price comes into either:
- An untested HTF POI (Breaker/OB/FVG). This will be based on the POIs enabled in the "HTF Points of Interest (POIs)" settings above, OR
- An untested Range Extreme. If the Range Extreme is tested, then it will exit at the highest high or Lowest Low beyond the extreme of a valid range
Trade Invalidations
.png)
Invalidation Rules
Configure when the system should automatically invalidate a pending setup.
1. Opposite HTF SFP Before Entry
Cancels pending orders if a Higher Timeframe Swing Failure Pattern (SFP)
forms against your direction.
Example: You are looking for a Long, but a Bearish SFP
prints.
.png)
2. Confirmed Opposite Setup
Cancels pending orders if a valid opposite signal is confirmed.
Example: Pending Long limit is cancelled because a Short signal
confirmed.
.png)
3. HTF Market Structure Break
Cancels pending orders if the Higher Timeframe Structure breaks against your trade idea. This prevents entering on a shifted trend.
4. Signal Pivot Outside MS
Invalidates setups if the specific candle formation (Signal Pivot) occurs outside the current valid Market Structure range.
Risk Management
Risk Management is the secret to staying in the game. Most pro traders never risk more than 1% of their account on a single trade.
Watch: Risk Management Basics.png)
| Setting | Description |
|---|---|
| Capital | Enter your current trading capital here |
| Lot Size | Enter Lot Size to display label/alert position size in lots |
| Risk Calculation Type | Select whether you want to use a percentage of your capital or a fixed 'dollar' amount to risk per trade |
| Max Risk Per Trade | Enter the maximum percentage of your capital or fixed 'dollar' amount to risk per trade |
| Maker Fee Per Trade (%) | Input the maker fee per trade provided to you from your exchange. This will be used in position sizing calculations |
| Taker Fee Per Trade (%) | Input the taker fee per trade provided to you from your exchange. This will be used to calculate fees on market orders (Stoplosses / Some Exits / Some Entries) |
| Stop Loss Ticks | Enter number of ticks stoploss should be placed away from SFP extremes. A Tick is the smallest denomination an instrument can trade |
| Max Leverage | Enter the leverage you wish to apply on your capital. Position sizing will always be based on your max risk per trade settings but using leverage on lower timeframes will give you larger position sizes while keeping true to your risk appetite |
| Use Taker Fees for Pos Size & TPs | Uses TAKER Fees for all exits in position size calculations. Useful on low timeframes where position sizing can be huge with leverage. If you get stopped with a large position size, the fees of the stop could end up being greater than the set max risk per trade. By enabling this feature, your position size will be reduced, but even if stopped, max loss won't exceed your set max risk parameters |
| Use Portfolio Value for Risk Calculations | Enable to use the portfolio value (Current Capital + Value of Open Positions) for position size calculations. Disable to use Available Capital for Position Size Calculations (Current Capital - Margin Used for Open Positions) |
| Set Stoploss to Entry at R:R | Enter R value for a position to achieve before moving a position's stoploss to its entry point |
| Use Breaker for Stoploss | Use the breaker extreme as your stoploss level instead of the SFP extreme |
Trading Sessions
.png)
| Setting | Description |
|---|---|
| Trade on Specified Days | Specify which days to activate trading on the indicator. Numeric
values are assigned to each day: 1 = Sunday 2 = Monday 3 = Tuesday etc |
| Session 1 | Enter a custom intraday session start and end time and toggle on to enable it. When enabled, trades will only be taken between the start and end times |
| Session 2 | Enter a custom intraday session start and end time and toggle on to enable it. When enabled, trades will only be taken between the start and end times |
| Session Timezone | Select your preferred timezone for the session timings entered above. Default is UTC. |
| Auto Close Position at Session End | Enable to automatically close any positions at the end of each enabled session |
Market Vs Limit Conditions
The system determines whether to suggest a Limit Order or a Market Order based on where price closes relative to your entry mode.
Limit Order
Triggered when price closes outside your entry mode extreme.
- Better Risk:Reward
- Risk of missing fill
.png)
Market Order
Triggered when price closes inside your entry mode.
- Guaranteed Entry
- Wider Stop / Lower R:R
.png)
VWAP Trend Filter
This is a separate indicator available exclusively to Pro tier subscribers.
Overview: Buyer vs. Seller Control
Brian Shannon's methodology focuses on a simple but powerful truth: Who is in control?
The VWAP Trend Filter acts as your compass. It doesn't just show an average price; it shows the objective average price paid by the market participants over a specific period. This allows you to instantly determine the market bias:
- Price > VWAP: Buyers are in control (Long Bias).
- Price < VWAP: Sellers are in control (Short Bias).
The Truth About Volume
"Price has memory. Why? Because people have memory. When an institution buys a massive position, they defend that level. Anchored VWAP isn't magic; it's just showing you where the 'smart money' has a vested interest in supporting the market. We don't guess; we let the volume tell us the story."
Overview
This indicator aims to identify the underlying market sentiment using various VWAP anchor points. The system operates with two primary anchor periods:
- Short Period
- Default is set to one day
- Long Period
- Default is set to one week
VWAP Levels Displayed
For each of these periods, the following VWAP levels are displayed:
- Current session VWAP
- Previous session VWAP
- Previous session's highest high VWAP
- Previous session's lowest low VWAP
Sentiment is visually represented with bullish or bearish colours, depending on whether the price closes above or below these levels. Once the two anchor periods are set the displayed levels remain static across all timeframes, so if you prefer looking for multiple confirmations on lower timeframes the levels will remain the same whether you're on the H1 or the M5
HOW TO USE: Brian Shannon teaches us to use multiple timeframes to gain a complete picture of market health. This tool automates that process.
1. As a Trend Filter (Confluence):
Don't fight the trend. Use the bands to filter your IMG Pro signals:
- Longs: Only take long signals when price is holding ABOVE the rising VWAP bands. This confirms buyers are supporting the move.
- Shorts: Only take short signals when price is holding BELOW the declining VWAP bands. This confirms sellers are defending lower prices.
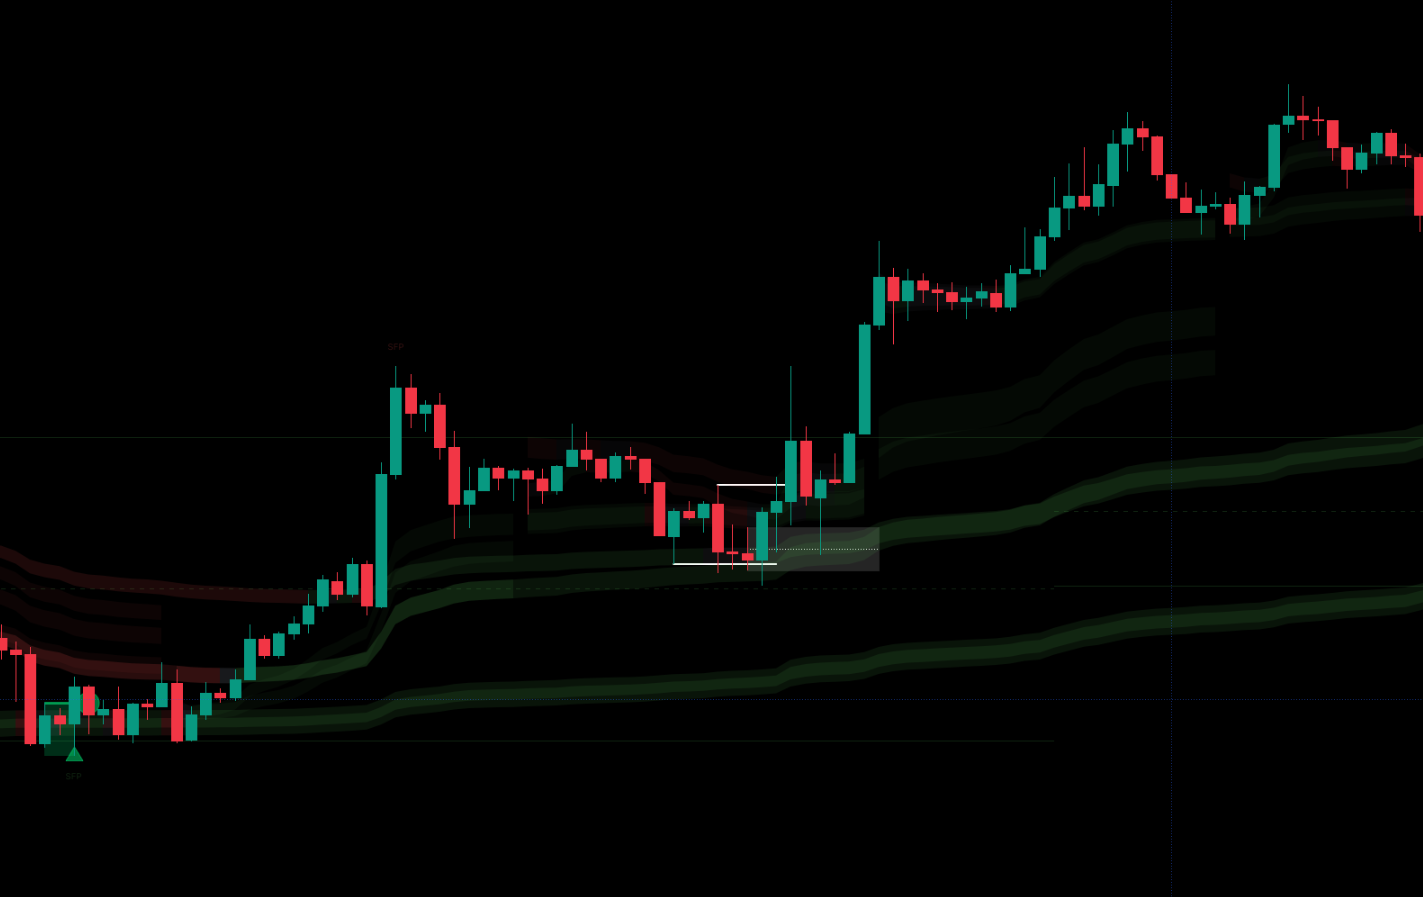
.png)
Example: Using VWAP bands to confirm the dominant trend direction.
2. As a Value Area (Entries):
In a strong trend, price often pulls back to the VWAP. This is where the institutions are likely to reload.
- Bullish Reload: Wait for price to pull back into the green bands. Look for a reaction (wick rejection, lower timeframe change of character) to enter.
- Bearish Reload: Wait for price to rally up into the red bands. Look for rejection signs to enter short.
- The "Hold": The key is not just touching the line, but holding it. We want to see the buyers step back in after the dip.
.png)
Note 1: Look for OBs that align with the bands in the direction you’re looking to trade as potential knife catch entry points
.png)
BINGX:BTCUSDT.P Chart Image by IMGPro
Note 2: Once a trend is established, wait to price to come back into the bands an print a setup (Sweep / BOS) and enter at breaker or OB that overlaps with the bands
Note 3: If you see something like this - price rallies, ranges/distributes over the weekend and starts of the next week with a bunch of red bands above price, that a pretty strong reversal signal. combine this with one of the two entry techniques above and you can ride it from the start.
.png)
Auto Anchored VWAP (AAVWAP)
This is a separate indicator available exclusively to Pro tier subscribers.
What is Anchored VWAP?
Standard VWAP resets every day. Anchored VWAP (AVWAP) allows you to tie the calculation to a specific event that matters.
By anchoring to a significant high, low, or news event (like earnings or FOMC), you can see the average price paid since that specific moment. This reveals the "breakeven" price for the participants who entered at that event.
Brian Shannon's Methodology: Significance Over Time
In Technical Analysis Using Multiple Timeframes, Brian Shannon advocates using Anchored VWAP to identify critical price levels where institutional memory is strongest. Traders use these levels to:
- Assess Control: Who is winning since the event? Buyers or Sellers?
- Confirm Trends: Is price making higher highs above the rising AVWAP?
- Pinpoint Entries: Buying pullbacks to the AVWAP (support) in an uptrend.
Market Memory
"The market has memory. When price returns to the average price paid since a major low (the Anchor), everyone who bought there is at breakeven. They are likely to defend their position. That's why these levels act as such powerful support and resistance. It's not magic lines; it's human psychology quantified."
2.1 Type Options
Type Dropdown:
Select the band calculation type:
- VWAP (default) - Uses volume-weighted data
- SMA - Simple Moving Average, for instruments without volume data
Band Type Dropdown:
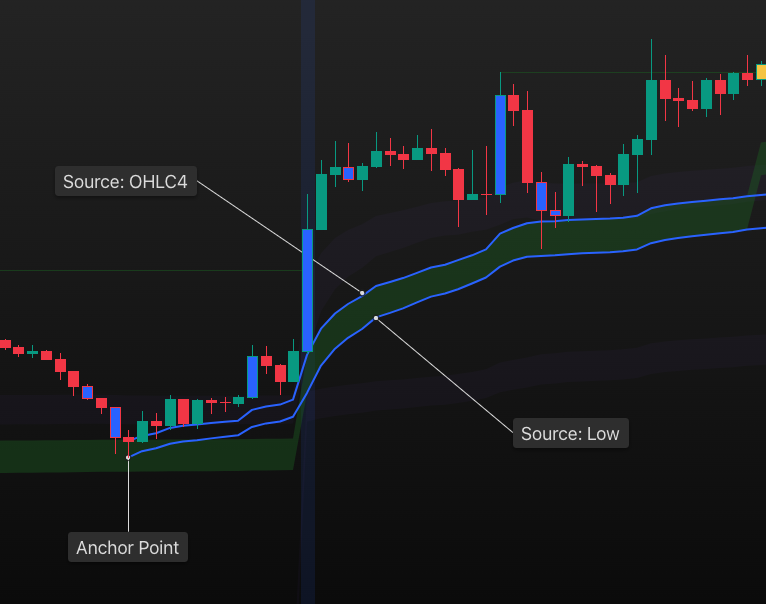
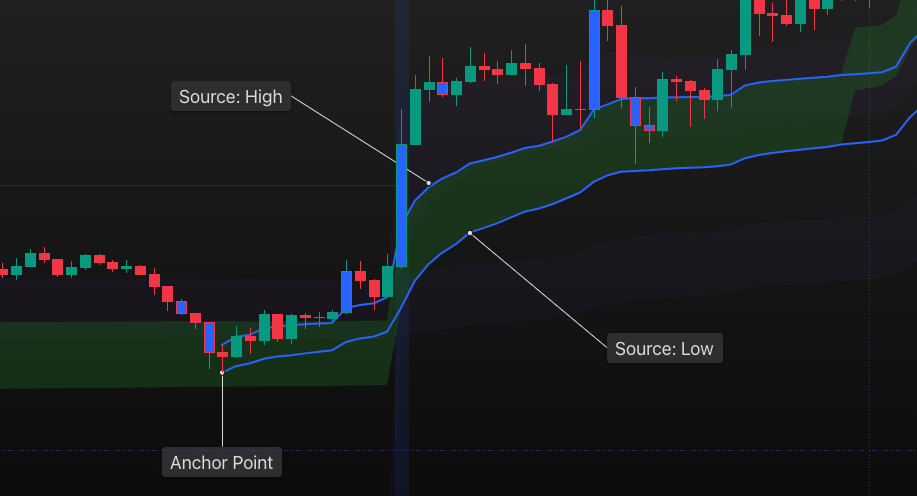
Select the band width to display. The system uses two source calculations from anchor points:
- OHLC4: Uses OHLC4 and Low (bullish) or OHLC4 and High (bearish). The upper part of the band is OHLC4 and lower part is from the auto-identified anchor point
- HIGH-LOW: Uses High and Low sources, regardless of market sentiment
- Lines: Only OHLC4 lines will be displayed. No bands.
Example: OHLC4 band type with bullish VWAP bands
Example: HIGH-LOW band type showing wider bands
2.2 Anchor Options
Anchor Period:
Used to:
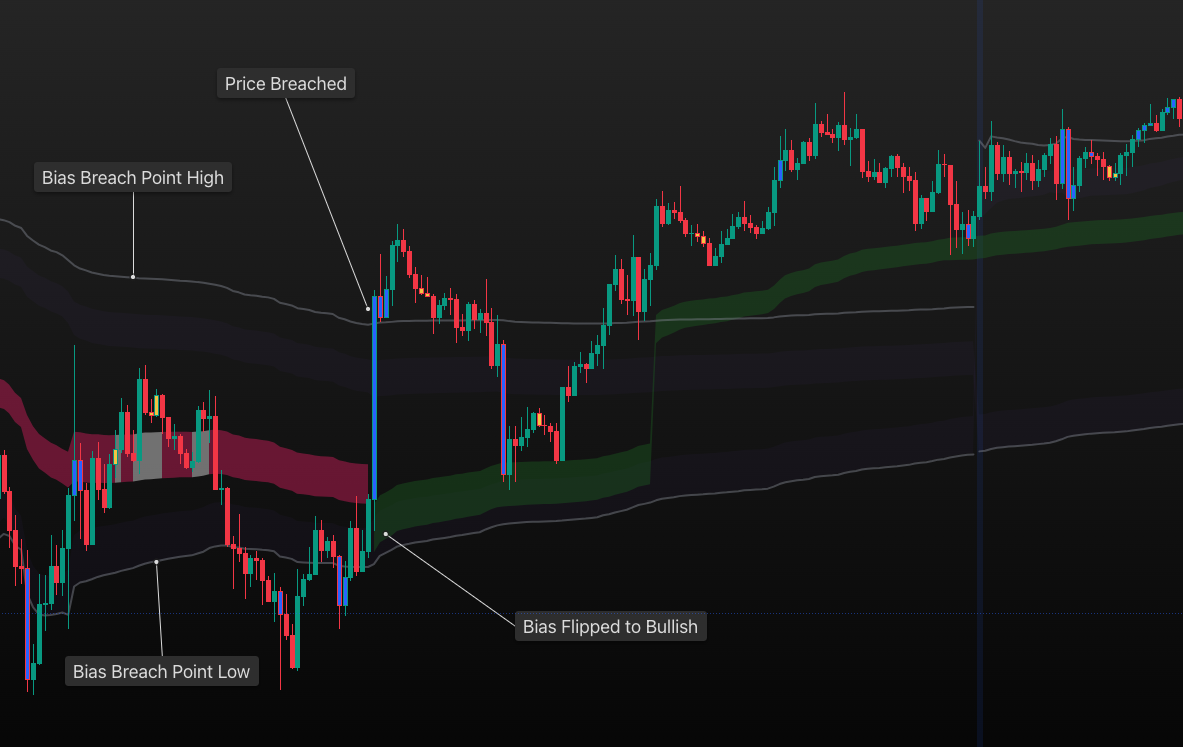
- Determine Breach Points for Bias: The system detects a shift in
bias when price hits "Breach Point" levels, calculated using the highest and
lowest of:
- Current Session VWAP
- Previous Session VWAP
- Previous Session Highest High VWAP
- Previous Session Lowest Low VWAP
- Display Session Based VWAPs/SMAs
Anchor Timeframe:
Anchor points and breach levels can vary based on the chart timeframe. For example, if your Anchor Period is 1 Week, it may display differently on H1. To mitigate this, select a specific chart timeframe to anchor to ensure consistency across all timeframes.
This is designed for drilling down to lower timeframes while anchoring to a higher timeframe. Example: anchor to H1 and view on M5.
Display Session Breaks:
Enable this to display a vertical line identifying the start of a new session (Anchor Period).
Example: Chart showing Bias Breach Points (High/Low) and Bias Flip to Bullish
2.3 Auto Anchor and Handoffs
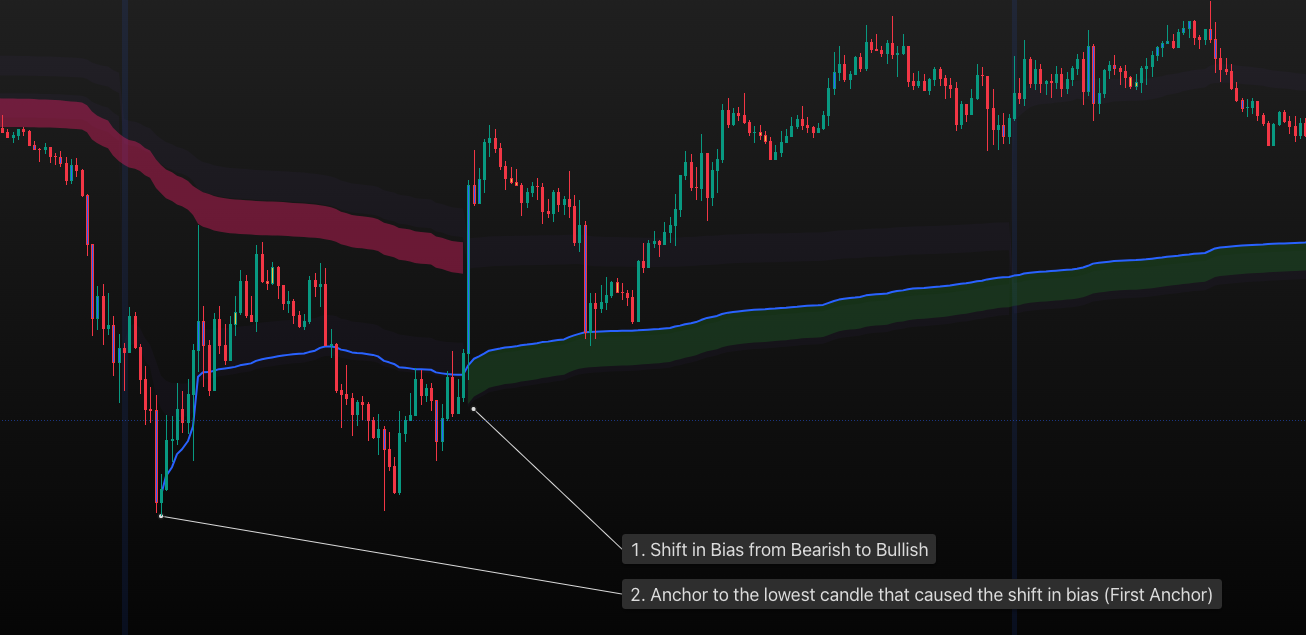
First Anchor:
Enable this to display the initial anchor after a shift in bias up until the point of an opposite shift in bias.
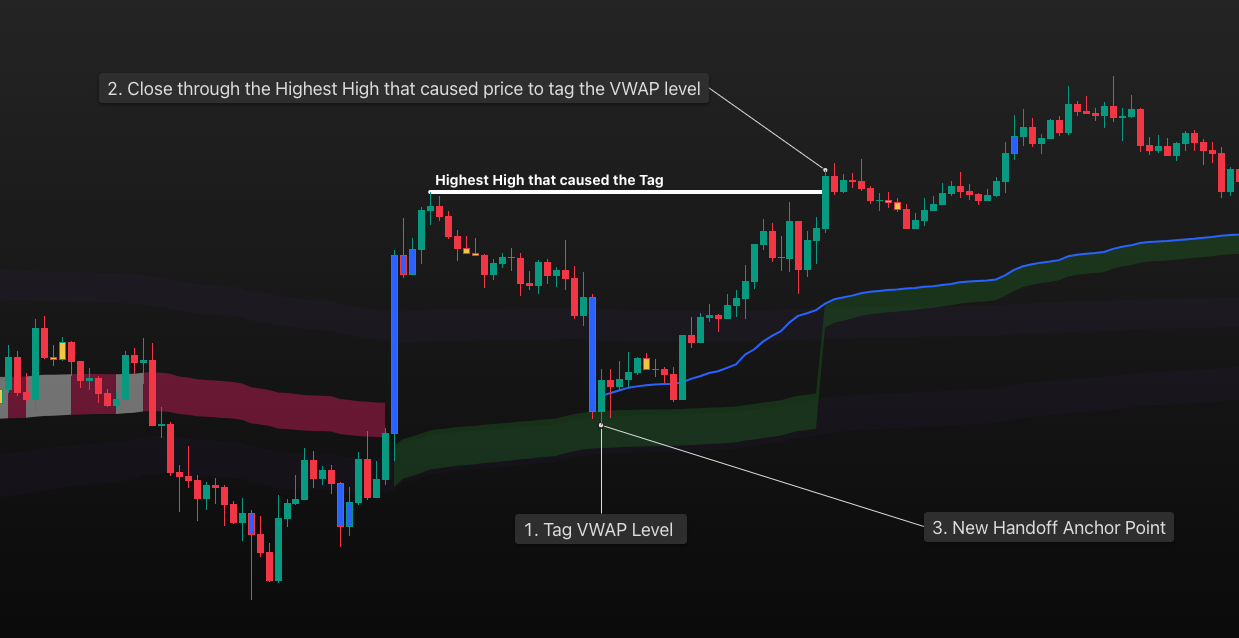
Handoff Anchors:
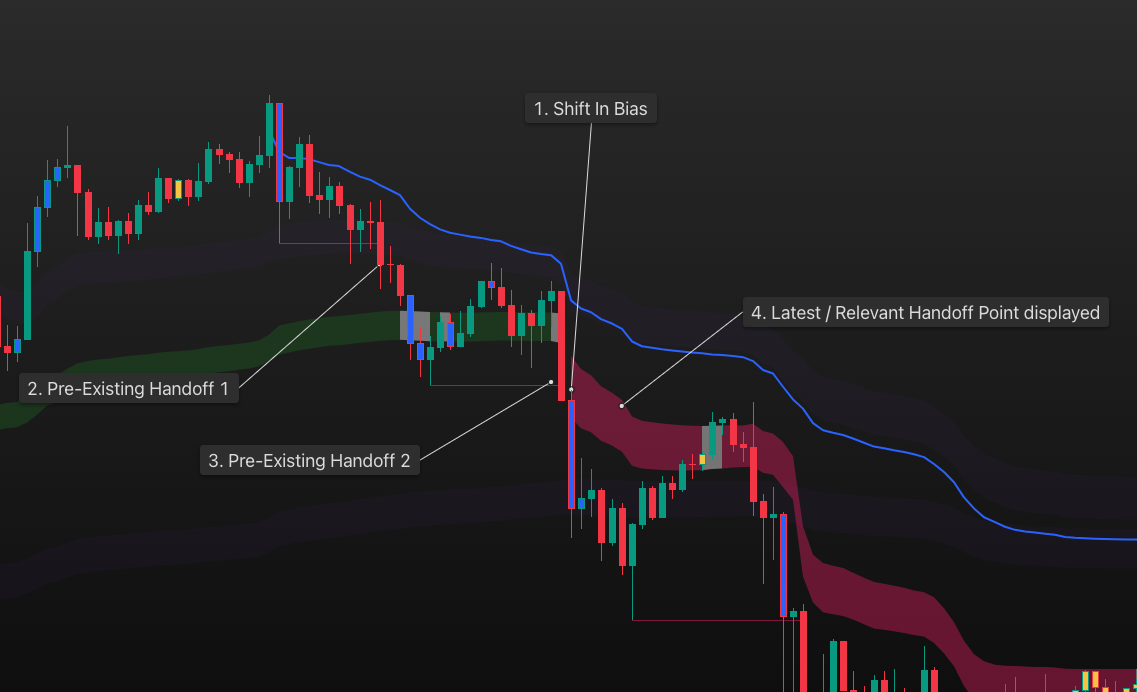
When price tags a VWAP level and moves significantly away from it, adding a fresh anchor to the last time price tagged VWAP is a Handoff Anchor.
Example of Handoff Anchors on a BTC Weekly chart (white arrows indicate handoff points)
Option 1: Using Breach Levels
- Price tags a breach level (without closing through it)
- Makes a close through Higher High (if bullish)
Option 2: Using VWAP Levels (enabled by default)
To use Option 1, disable 'Require Anchor Tag and Breach for Handoffs'
- Tag a VWAP Level (Either First or an existing handoff)
- Close through the highest high that caused price to tag the VWAP level
Option 2: Using VWAP Levels to determine handoff points
Handoff Sensitivity:
Select between OHLC4 and High-Low bands to determine handoff points. High-Low is more sensitive/aggressive as the band width is wider, resulting in more aggressive handoffs.
Anchor Tag and Breach for Handoffs:
See Option 2 above.
Display Handoff Breach Lines:
Enable this to display the breach lines for a handoff to occur using Option 2 (i.e., the highest high that caused price to tag VWAP if bullish, or the lowest low if bearish). Lines will only display once they have been breached.
Enable Pre-Existing Handoffs:
Enabling this will get the system to calculate if there were already any handoffs prior to a shift in bias, displaying the most current and relevant VWAP handoff as soon as a shift in bias occurs. This only works with Option 2.
2.4 Session Anchors
Use these options to display the current and previous session anchors based on the selected Anchor Period.
NB: Use the transparency input to adjust brightness. The slider in the colour picker is disabled.
2.5 Debug Options
These options will display the Bias shift Breach levels and the anchor points for First Anchor and subsequent Handoffs.
Suggested Confluence: The Ultimate Edge
Combining IMG Pro + Brian Shannon's AVWAP
The true power lies in the combination. IMG Pro signals tell you when a move might start (Order Blocks, FVGs, Sweeps), while Anchored VWAP tells you where the smart money is defending their positions.
The "Perfect Storm" Setup:
- Step 1: Trend Alignment (Filter): Ensure price is holding above the rising Short-Term VWAP bands (for longs).
- Step 2: The Signal (Trigger): Wait for an IMG Pro Order Block or Breaker to form exactly at the VWAP level.
- Step 3: The Execution (Entry): Enter on the retest of that Order Block. You now have structural support (IMG) AND volume support (AVWAP) at your back.
When to Strike
"Amateurs look for one magic indicator. Professionals look for confluence. When price pulls back to a rising Anchored VWAP and you get a clear price action signal (like a higher low or a breakout), that is the lowest risk, highest probability entry you will find. We don't buy the dip blindly; we buy the confirmation of the dip."
Master Curriculum
Part 1: Video Library
Click on a topic to jump to its relevant section where you can watch the embedded video.
Inspired Insights
AI Transparency & Methodology
The 'Inspired Insights' sections throughout this manual are AI-generated paraphrases written in a conversational, first-person style.
They are based on AI models trained on the publicly available content of Trader Mayne and Brian Shannon. The AI applies their core concepts directly to the IMG Pro user manual to make them easier to understand and more relevant to the indicator's features.
These are NOT direct quotes. They are summaries and interpretations to help users connect expert philosophies to the tool. Always refer to the linked original sources for their exact words and full context.
Part 1: Mayne-Inspired Insights Index
Click on a principle to jump to its explanation in the manual.
Part 2: Shannon-Inspired Insights Index
Core concepts from Brian Shannon's Anchored VWAP Methodology.
Miscellaneous
Creating a Custom Timeframe in TradingView
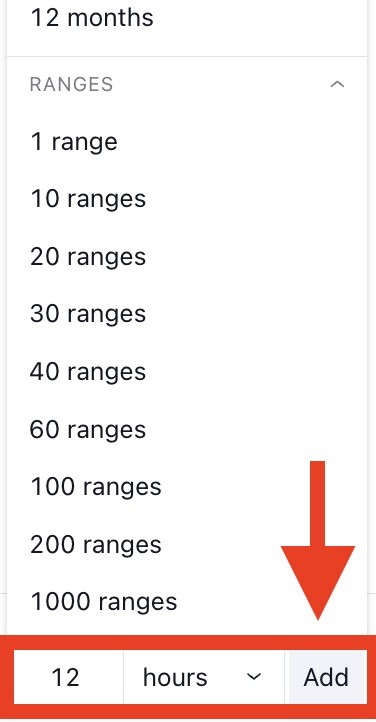
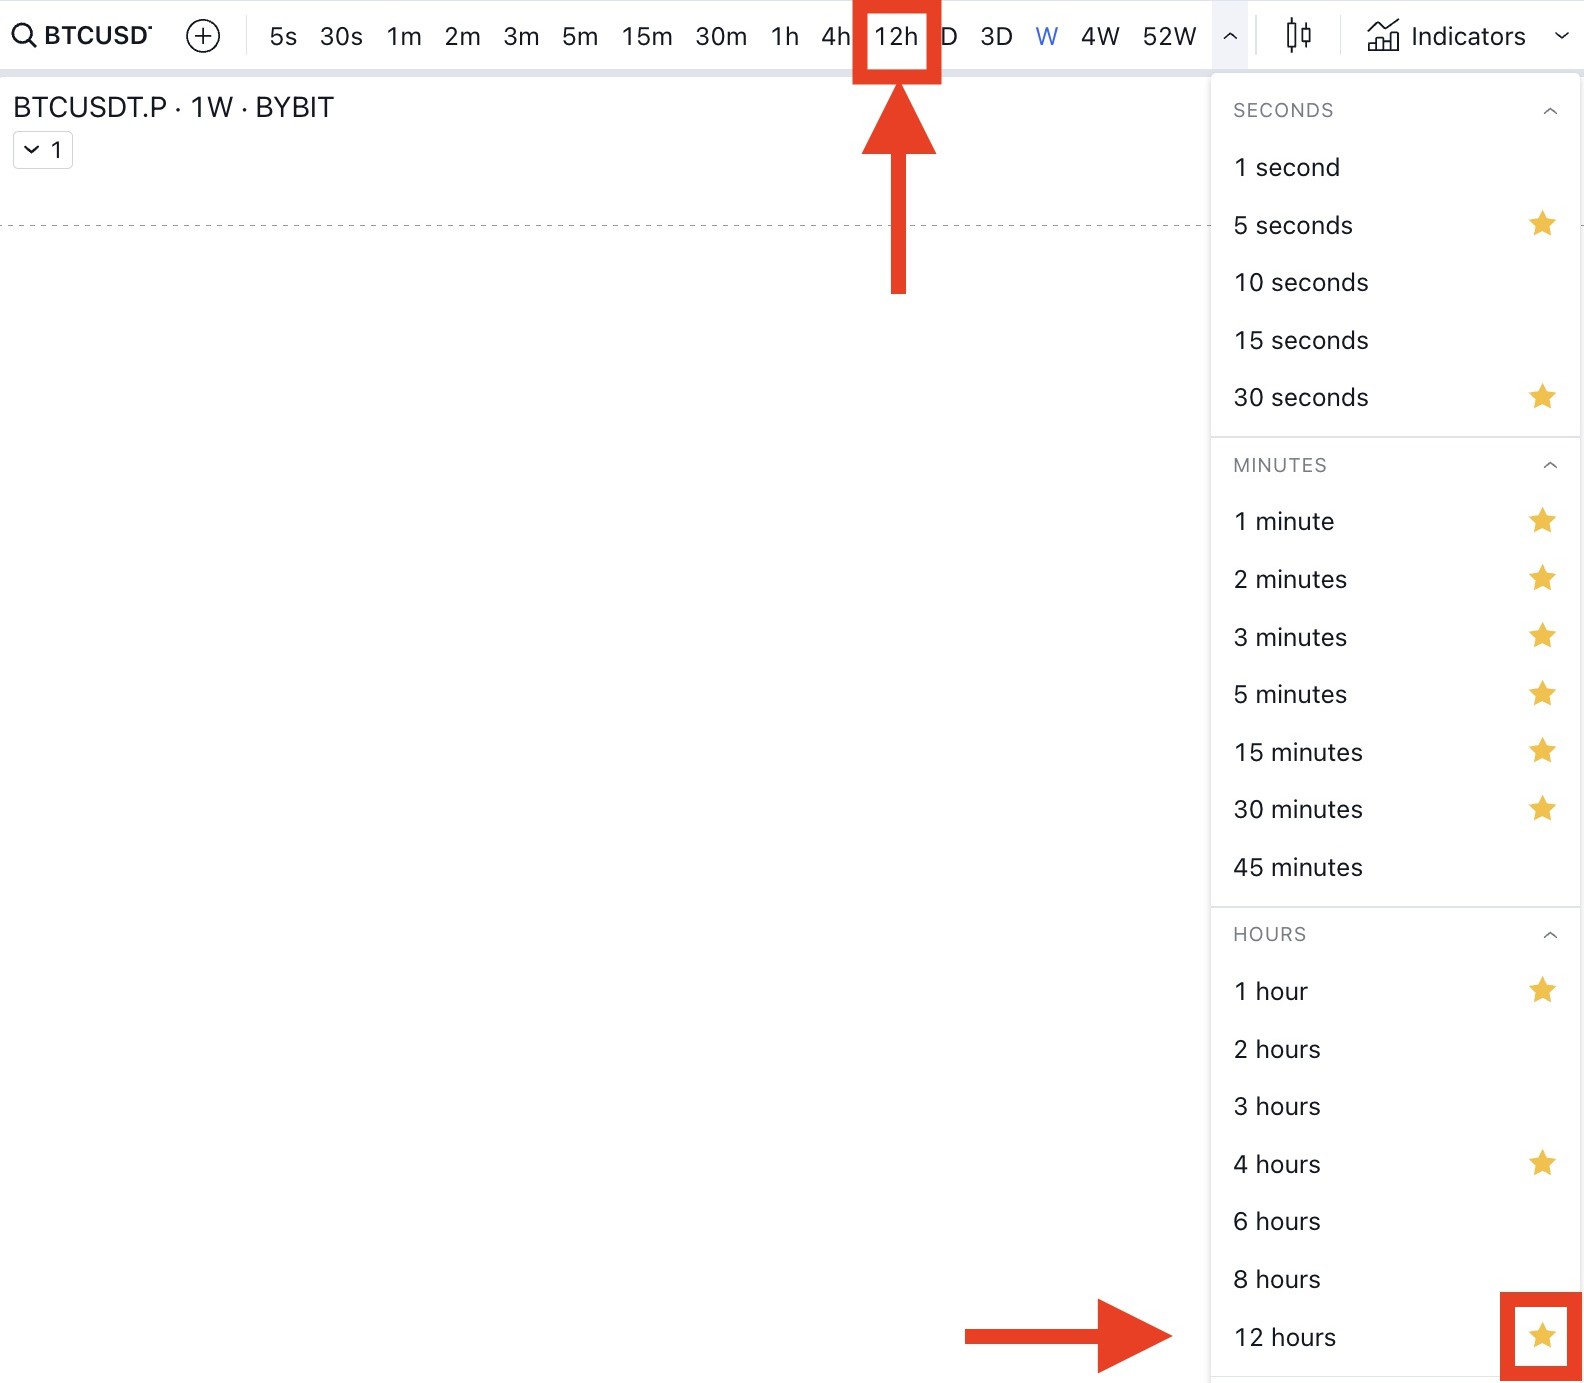
How to Add a Custom Timeframe
- Open the Timeframe Dropdown located above your chart.
- Scroll to the bottom, enter your desired timeframe (e.g., 12h, 2 Days), and click "Add".
- "Star" the new timeframe to add it to your favorites bar.
- The new timeframe will now appear in the IMG Pro HTF Structure dropdown.
.png)
Why use Custom Timeframes?
Standard timeframes (Daily, Weekly) are great, but sometimes the market structure is clearer on intermediate frames like the H12 (12-Hour) or 2-Day (2D). Adding these gives you more flexibility to find the "cleanest" trend.
Example: H12 Market Structure overlaid on an H1 Chart. View Live Chart Example
Setting Up TradingView Alerts
If TradingView Alerts are enabled, the indicator will fire an alert based on your settings.
IE: if a label prints on screen, you will be prompted with a TradingView Alert unless Alerts: ‘Valid Signals’ is selected in Basic Settings in which case only valid trade signal alerts will be generated.
How to Configure Alerts
- Right-click on the indicator (or the chart background) and select "Add
Alert on IMG...".
.png)
- Customize the Alert Name in the message tab. This is what you
will see on your phone/screen.
.png)
- Click "Create".
.png)
Indicator Labels
SFPs
Displayed directly above/below the swing point.
Trade Signals
Green/Red Triangles. The generated trade idea.
Trade Entries
Circles. Where the limit order opens.
Invalidations
Grey Triangles. Cancelled or invalid trades.
Stop Loss
Grey Squares. Where the stop loss is placed.
Take Profits
Green/Red Squares. Where profits are taken.
.png)
Study Errors
A study error (red exclamation mark) may display next to the indicator name on the top left corner of your screen. Error details can be revealed by clicking on the red exclamation mark
Common error messages and how to resolve them.
Message: "The Market Structure Timeframe must be divisible by the active chart timeframe."
Solution: Ensure your HTF Structure setting (e.g., 4H) is a multiple of your Chart Timeframe (e.g., 15m). 4 Hours / 15 Minutes = 16 (Whole Number) -> OK. 4 Hours / 7 Minutes = Decimal -> Error.
.png)
Message: "Study Error" or Red Exclamation Mark.
Cause: TradingView memory limits reached due to too many active calculations (all features enabled on low timeframe).
Solutions:
- Reduce the number of open charts or active indicators.
- Disable features you aren't using (e.g., Turn off "Show All Pivot Highs/Lows").
- Refresh the browser or switch timeframes back and forth.
.png)